As part of my learning routines, I’m reviewing my knowledge on reservoir modeling, particularly on static reservoir modeling workflow through a public course from March to October 2024. The course using the Gulfaks field, an oil & gas field located in the Norwegian part of the North Sea shelf that operated by Statoil since 1986, as the demo data. Throughout this course, I learn a complete workflow of reservoir static modeling, from data loading to volumetric calculation.
The Gulfaks Dataset
The Gulfaks known as a classic North Sea oil field with rotated fault blocks trending in a North-South direction & produces oil from Middle Jurassic sandstone in the Brent Group (Tarbert Fm, Ness Fm, and Etive Fm), and from Lower Jurassic and Upper Triassic sandstone in the Statfjord Group and Cook and Lunde Formations.
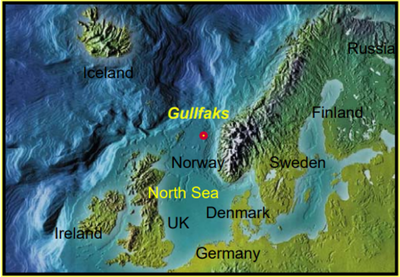
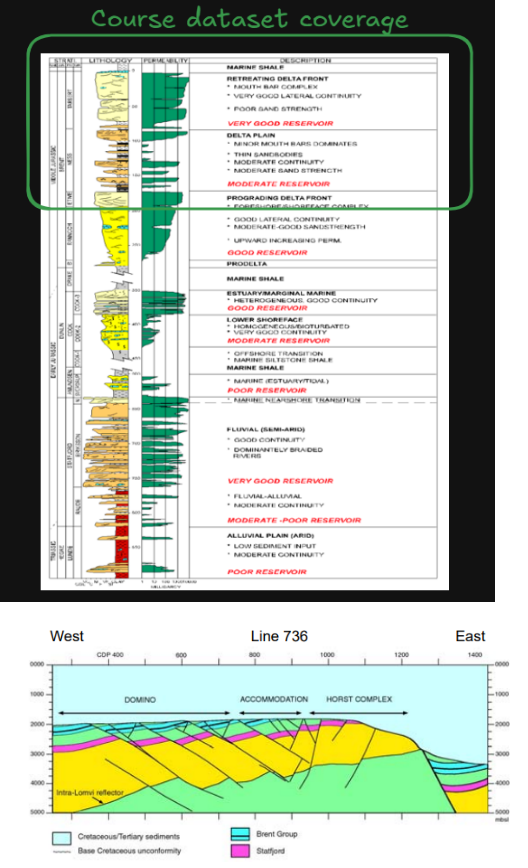 Figure 1. Gulfaks field location
Data Loading
Importing and QC wells data (tops, logs, and deviation) in order for having good data integrity for modeling process.
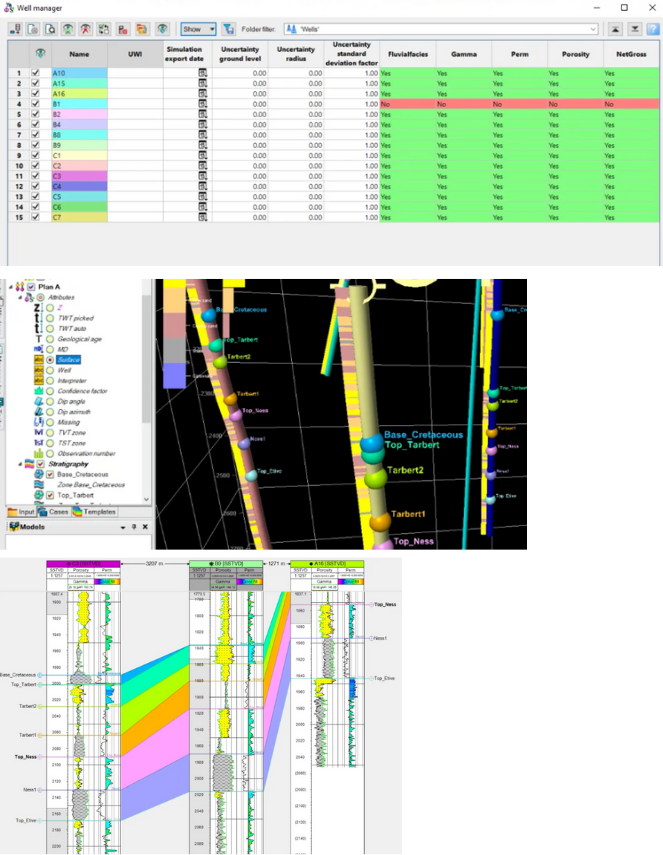 Figure 2. Data loading (tops, log, and deviation)
Seismic Interpretation
Interpreting fault and horizon as the foundation of reservoir structural model.
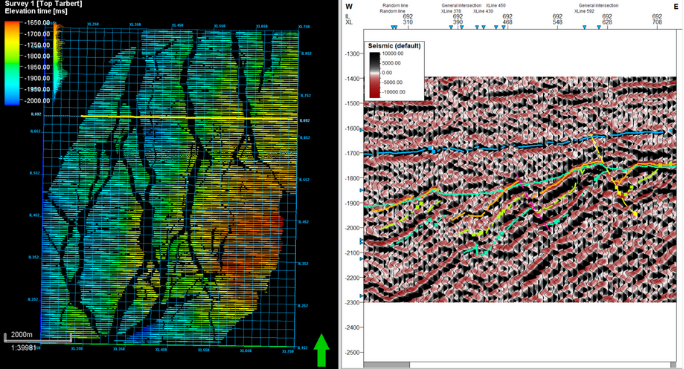 Figure 3. Seismic interpretation
Surface Map
Generated various surface maps (depth, time, & RMS attribute) as pre-liminary interpretation output.
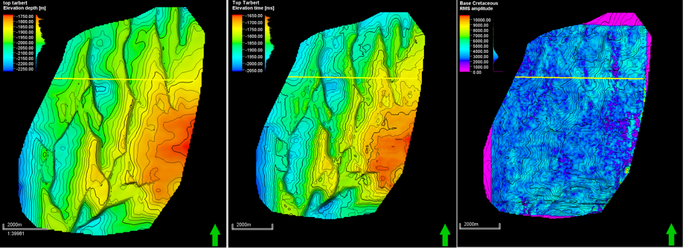 Figure 4. Surface map (depth, time, & RMS attribute)
Fault Modeling
Performed fault modeling (manual & automatic) to review each fault relationship and build the fault framework model.
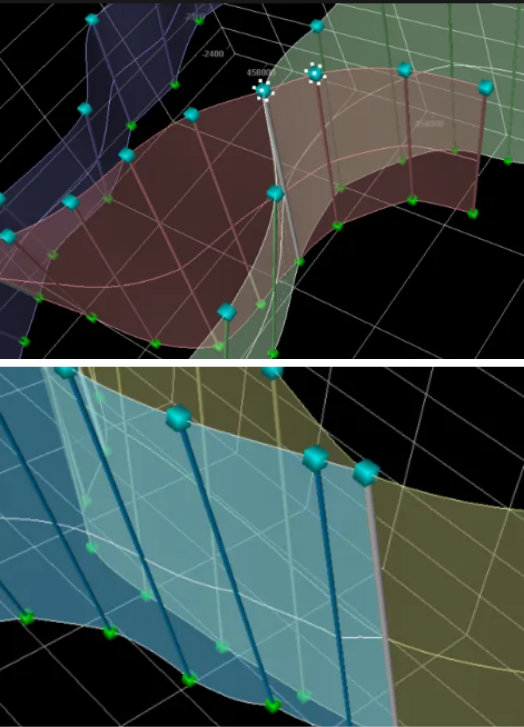 Figure 5. Fault modeling (manual & automatic)
Pillar Gridding
Defined the reservoir boundary and segment for modeling constraint.
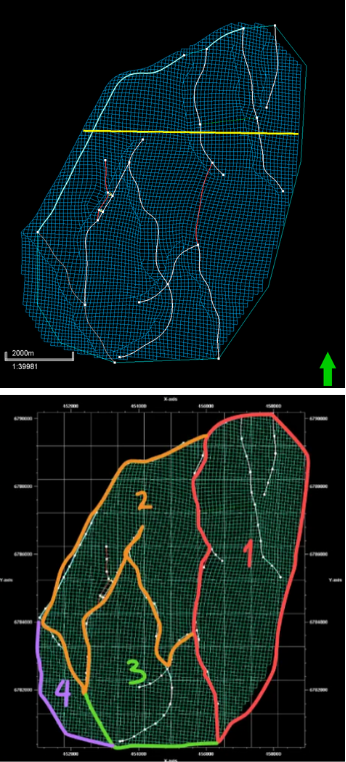 Figure 6. Pillar gridding (boundary & segment)
Zonation & Layering (Z-gridding)
Define the number of zone and layer refering to the stratigraphic data.
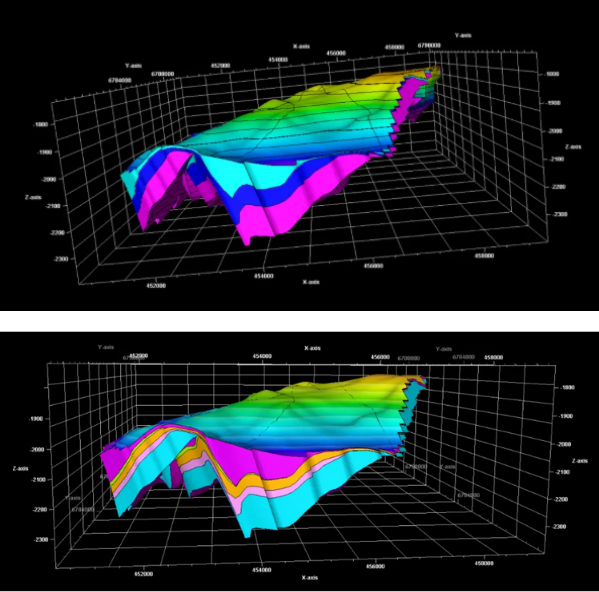 Figure 7. Zonation & layering (Z-gridding)
Geometrical Modeling & Grid QC
Revisit the structural modeling results by calculating the geometrical parameters of the structural model.
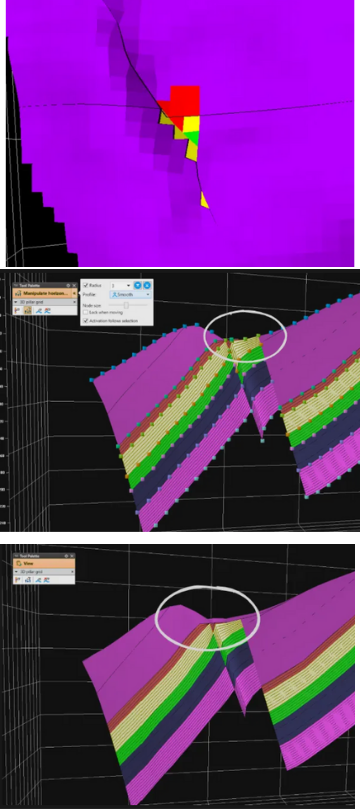 Figure 8. Geometrical modeling & grid QC
Well Log Upscaling
Averages log values to the cells in the 3D grid that are penetrated by the wells which later used as the starting point of property modeling.
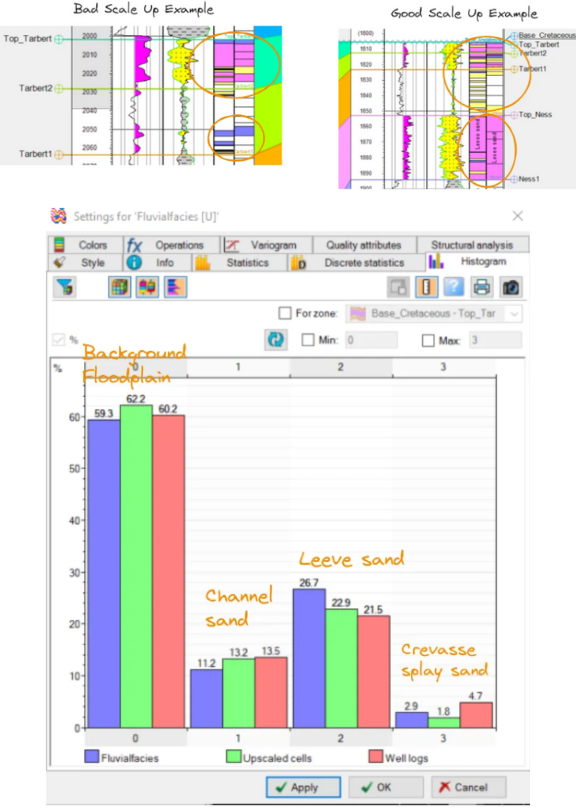 Figure 9. Well log upscaling
Property Modeling
Generated property model (facies & petrophysical) by assigning property values in between the well logs based on the logs data.
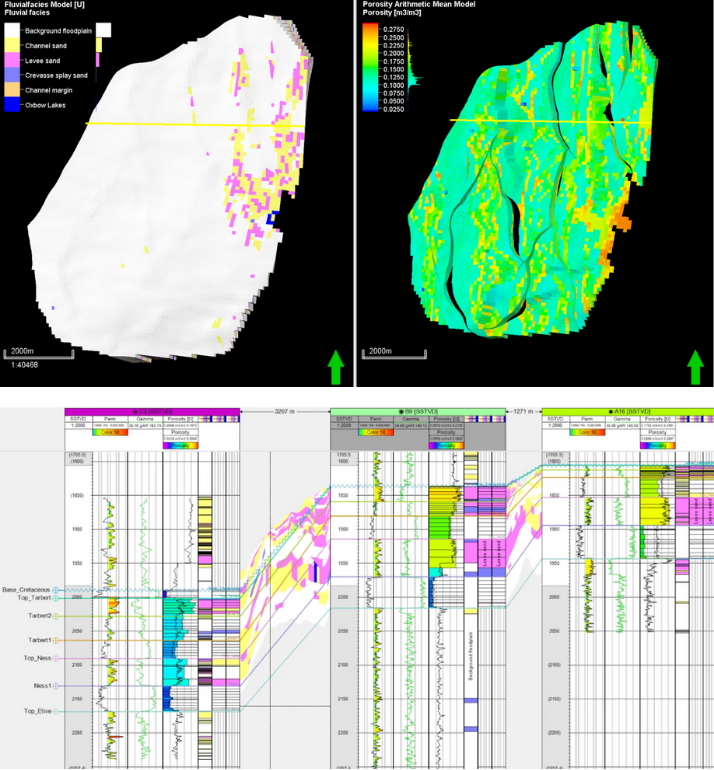 Figure 10. Property modeling (facies & petrophysical)
Hydrocarbon Contact Map
Generated fluid contact map based on the gas, oil, and water contact depth.
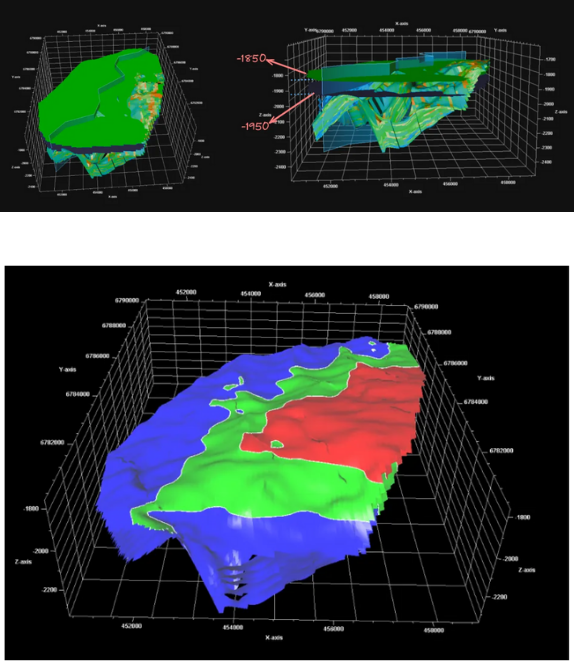 Figure 11. Hydrocarbon contact map
Volumetric Calculation
Calculated hydrocarbon valume based on various reservoir data (rock volume, porosity, fluid saturation, and geological factor) without consider fluid dynamics flow.
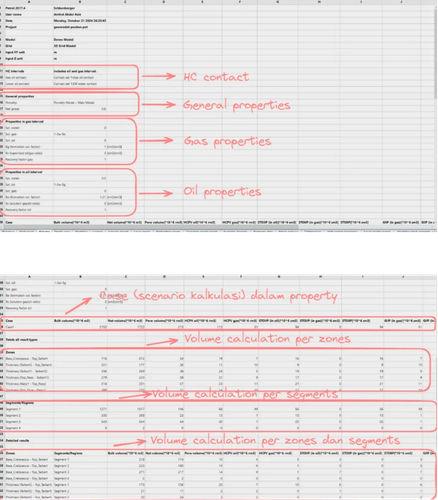 Figure 12. Volumetric calculation